
PLANO, Texas, Sep 10, 2025 (SEND2PRESS NEWSWIRE) — Optimal Blue today released its August 2025 Market Advantage mortgage data report, which found a sharp split between purchase and refinance trends as seasonal factors and falling rates reshaped origination activity. Total lock volume dipped about 2% month over month (MoM) as a roughly 10% drop in purchase locks outweighed the strongest month for rate-and-term refinances this year, which surged nearly 70%. Non-QM lending also reached a new milestone in August, climbing to a record 8.3% of originations – up from 5.6% a year earlier and just 1.4% in August 2020 – extending the steady growth trend first highlighted in last month’s report.
“Borrowers are responding quickly to rate improvements, driving the strongest month for rate-and-term refinances we’ve seen this year,” said Mike Vough, head of corporate strategy at Optimal Blue. “At the same time, purchase activity is beginning its typical seasonal decline, while product mix is shifting with non-QM lending at record levels.”
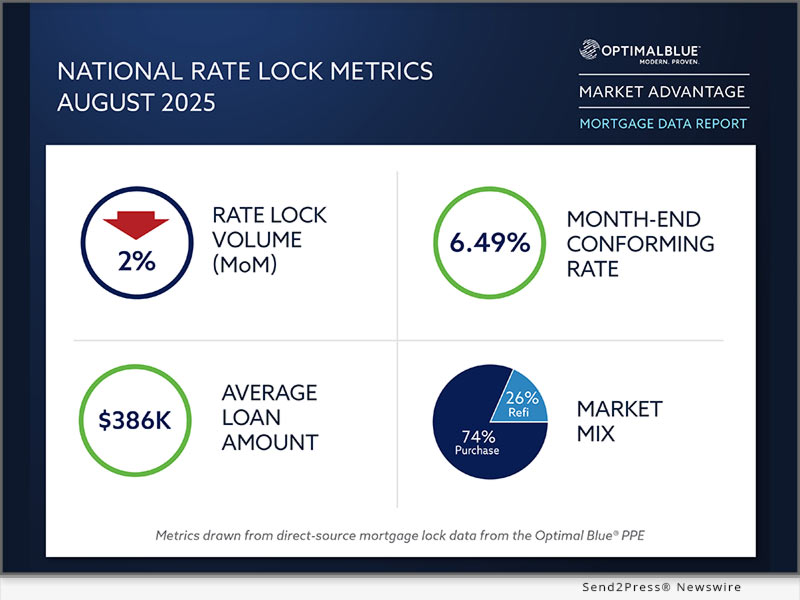
The OBMMI 30-year conforming fixed rate, the benchmark for CME Group’s Mortgage Rate futures, ended August at 6.49%, down nearly a quarter point from July. Jumbo, FHA and VA rates also declined, falling 32, 24 and 33 basis points (bps), respectively.
The report also pointed to significant changes in capital markets execution, with securitization playing a larger role in loan sales. Agency cash window deliveries fell to 24% while agency MBS executions climbed to 40%, highlighting stronger securitization activity among larger lenders.
“This trend underscores how lenders are strategically adapting to optimize execution in order to gain market share,” Vough said. “We’re seeing deeper engagement in securitization alongside more loans sold to the highest price during loan sales, signaling that capital markets strategies are adjusting to increase profitability.”
Key findings from the Market Advantage report, derived from direct-source mortgage lock and secondary market data, include:
Volume trends and market composition
* Lock volumes dip: Overall activity slowed 1.8% in August as the seasonal decline in purchase demand outpaced gains in refinance activity.
* Purchase volumes slip: Purchase volume fell 9.8% MoM but remained flat year over year (YoY), ushering in the typical post-peak season slowdown.
* Refis surge: Refinances rose to 26% of originations, up sharply MoM and YoY, as rate-and-term refinances surged 69.8% while cash-outs gained 2.2%.
Rates and pricing
* Benchmark rates drop: The OBMMI ended August at 6.49%, down nearly a quarter point from July. Jumbo rates fell 32 bps to 6.57%, FHA decreased 24 bps to 6.26% and VA declined 33 bps to 6.00%, creating opportunities across loan types.
* Pricing strength improves: Loans sold at the highest pricing tier rose to 75%, a 5-point increase, suggesting lenders delivered cleaner loan profiles and captured stronger pricing.
* MSR valuations soften: MSR values dipped to 1.15% for conforming 30-year loans, down 4 bps, in line with lower rates that compressed servicing valuations.
Channel and execution
* Cash share declines: Agency cash window sales fell 200 bps to 24% as lenders leaned less on cash executions in favor of strategic delivery methods.
* MBS executions rise: Agency MBS executions climbed to 40%, reflecting increased securitization by larger lenders optimizing capital markets execution and market share.
* Pull-through rates mixed: Purchase pull-through rose 22 bps to 84.2%, while refinance pull-through slipped 15 bps to 61%, indicating some softening in refi pipeline performance.
Product mix and borrower profiles
* Non-QM hits record: Non-QM share rose to 8.34% of all originations in August, up from 8.03% in July and setting a new record high.
* Conforming declines: Conforming share fell 123 bps to 51%. VA loans gained 78 bps to 12.1%, non-conforming increased 48 bps to 17.3%, FHA edged up 1 bp to 19% and USDA dipped 5 bps to 0.7%.
* New build activity softens: Planned unit development (PUD) lending fell below 28% of production, down more than 4.5% YoY as new construction market share continued to contract.
* FTHB activity steady: First-time homebuyer share held flat for conforming and FHA loans and dipped slightly for VA.
* Borrower profiles remain strong: The average conforming FICO Score was 756, unchanged MoM. Average loan amounts rose to $386,387 from $382,476 in July, ranging from $600,110 in metro New York to $304,511 in Indianapolis. Average LTVs ranged from 73.56 in New York to 81.61 in Indianapolis.
* ARMs hold: Adjustable-rate mortgages accounted for 10.25% of overall lock activity.
To view the full August 2025 Market Advantage report, complete the free subscription form: https://engage.optimalblue.com/market-advantage. Subscribers receive a report PDF each month with the latest data. Members of the press are eligible for special, advance access each month and should contact Olivia DeLancey to be added to the media list.
This month’s Market Advantage podcast features Optimal Blue Chief Technology Officer Seever Sulaiman. Access the podcast: https://market-advantage.captivate.fm/episode/episode-12 .
About the Market Advantage Report
Optimal Blue issues the Market Advantage mortgage report each month to provide insight into U.S. mortgage trends and drivers of lending profitability. Data is sourced from the Optimal Blue PPE, which is used to price and lock more than one-third of all mortgages nationwide, and Optimal Blue’s hedging and loan trading system, which supports approximately 40% of loans hedged and sold into the secondary market. As the leader in mortgage capital markets technology, Optimal Blue has a direct view of both origination and secondary market activity, and the interconnectedness of the two. Unlike self-reported survey data, Optimal Blue’s direct-source data accurately reflect the in-process loans in lenders’ pipelines and secondary market executions. Visit Optimal Blue’s website to subscribe to receive the free report each month.
Nothing herein shall be construed as, nor is Optimal Blue providing, any legal, trading, hedging, or financial advice.
About Optimal Blue
Optimal Blue powers profitability across the mortgage capital markets ecosystem. As the industry’s only end-to-end capital markets platform, our technology, data and integrations bridge the primary and secondary markets to help lenders of all sizes maximize performance – from pricing accuracy to margin protection and every step in between. Backed by over 20 years of proven expertise, our modern, cloud-native technology delivers the real-time automation, actionable data and seamless connectivity lenders need to navigate market volatility and scale for growth. To learn more about how Optimal Blue delivers measurable ROI, visit OptimalBlue.com.
News Source: Optimal Blue
Related link: https://www2.optimalblue.com/
This press release was issued on behalf of the news source, who is solely responsible for its accuracy, by Send2Press Newswire. To view the original story, visit: https://www.send2press.com/wire/refinances-surge-nearly-70-as-purchase-activity-falls-10-in-august/


