
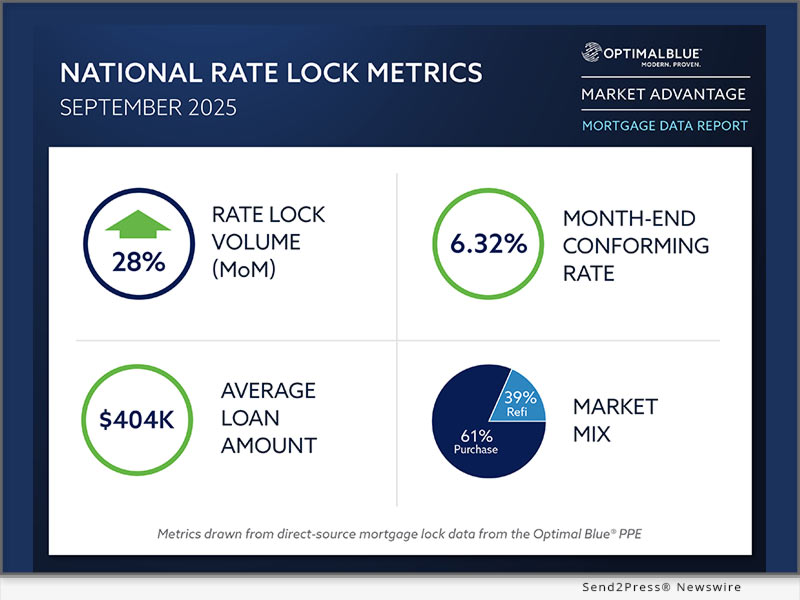
PLANO, Texas, Oct 14, 2025 (SEND2PRESS NEWSWIRE) — Optimal Blue today released its September 2025 Market Advantage mortgage data report, which showed a sharp increase in rate-lock activity as mortgage rates fell throughout the month to their lowest levels in nearly a year. Total lock volume rose 28% month over month (MoM), led by a surge in refinance lending as borrowers seized on the opportunity to lower monthly payments. Purchases also climbed 6% MoM, outperforming typical seasonal trends as improved affordability brought more buyers into the market.
“The rate rally that began in late summer accelerated in September, and borrowers reacted quickly,” said Mike Vough, head of corporate strategy at Optimal Blue. “Rate-and-term refinance locks jumped 153% month over month, lifting total refi share to 39% – the highest level we’ve seen in more than two years. That momentum also spilled into purchase lending as affordability improved, particularly for first-time homebuyers.”
The Optimal Blue Mortgage Market Indices (OBMMI) 30-year conforming fixed rate, the benchmark for CME Group’s Mortgage Rate futures, ended September at 6.32%, down 18 basis points (bps) from August. Jumbo rates dropped 11 bps to 6.47%, FHA fell 18 bps to 6.08% and VA declined 18 bps to 5.82%, reinforcing the broader affordability shift seen across loan types.
The report also highlighted notable movements in capital markets execution. Sales to the agency cash window and aggregators each fell 100 bps to 23% and 32% respectively, while agency mortgage-backed security (MBS) executions increased to 42% from 40%, reflecting stronger securitization activity among large lenders. The share of loans sold at the highest pricing tier climbed to 78%, up 300 bps, suggesting less focus on delivery profiles and fewer eligibility exceptions influenced pricing decisions.
“This combination of stronger pricing and greater securitization participation underscores lenders’ efforts to optimize execution as volume rebounds while maintaining profitability,” Vough said. “Even as MSR values edged down 6 bps in September, nearly eight in ten loans were sold at the highest pricing tier, showing how lenders are offsetting that compression through broader investor engagement.”
Key findings from the Market Advantage report, derived from direct-source mortgage lock and secondary market data, include:
Volume trends and market composition
* Lock activity jumps: Total rate-lock volume increased 28% in September as falling rates reignited borrower demand.
* Purchase volume rises: Purchase locks climbed 6% MoM and 9% year over year (YoY), outperforming typical late-season expectations.
* Refinances dominate growth: Refi share expanded to 39% of all locks – the highest since early 2022 – driven by a 153% MoM increase in rate-and-term refinances and a 13% gain in cash-outs.
* Refi pull-through improves: The pull-through rate for purchases climbed 58 bps to 83.6%. Refinance pull-through rose 82 bps to 60.2%.
Rates and pricing
* Rates retreat across loan types: The OBMMI 30-year conforming fixed rate fell 18 bps to 6.32%. Jumbo rates dropped 11 bps to 6.47%, FHA loan rates fell 18 bps to 6.08% and VA loan rates declined 18 bps to 5.82%.
* MSR valuations ease: Servicing values for conforming 30-year loans slipped 6 bps to 1.09% (a 4.36 multiple), mirroring rate declines and an average 30 bps drop in OBMMI levels across the month.
* Lenders capture stronger execution: The share of loans sold at the highest pricing tier climbed to 78%, up 300 bps from August, signaling decreased focus on lender profile and eligibility and stronger focus on improved profitability.
Channel and execution
* Securitization strengthens: Agency MBS executions increased to 42% from 40%, while deliveries to the agency cash window and aggregators fell 100 bps each to 23% and 32%, respectively.
* Investor engagement steady: The average number of active investors held at 11, consistent with recent months as secondary market liquidity remained stable.
Product mix and borrower profiles
* Conforming and VA gain share: Conforming and VA each picked up just over 1 percentage point of market share as borrowers in those segments moved quickly to refinance.
* Credit profiles strengthen in refis: Average credit scores rose to 746 (up 9 points) for rate-and-term refinances and to 701 (up 7 points) for cash-outs as higher-credit borrowers responded first to lower rates.
* DTI trends lower: Debt-to-income ratios declined for both conforming and FHA production and were down across all products YoY, signaling improving affordability.
* FTHB participation increases: First-time homebuyer share rose in both FHA and VA production – up 1 bp each – while conforming was unchanged.
* Loan amounts edge higher: The average loan amount was $403,746, up from $386,387 in August and $382,476 in July. September averages ranged from $605,542 in metro New York to $305,829 in Indianapolis. Average LTVs ranged from 73.57 in New York to 82.22 in Indianapolis.
To view the full September 2025 Market Advantage report, subscribe for free: https://engage.optimalblue.com/market-advantage. Subscribers receive a report PDF each month with the latest data. Members of the press are eligible for special, advance access each month and should contact Olivia DeLancey to be added to the media list.
This month’s Market Advantage podcast features Andria Lightfoot, vice president of client success at FirstClose. Access the podcast: https://market-advantage.captivate.fm/episode/episode-13.
About the Market Advantage Report
Optimal Blue issues the Market Advantage mortgage report each month to provide transparency and insight into U.S. mortgage trends and drivers of lending profitability. Data is sourced from the Optimal Blue PPE, which is used to price and lock more than one-third of all mortgages nationwide, and Optimal Blue’s hedging and loan trading system, which supports approximately 40% of loans hedged and sold into the secondary market. As the leader in mortgage capital markets technology, Optimal Blue has a direct view of both origination and secondary market activity and the interconnectedness of the two. Unlike self-reported survey data, Optimal Blue’s direct-source data accurately reflect the in-process loans in lenders’ pipelines and secondary market executions. Visit Optimal Blue’s website to subscribe to receive the free report each month.
Nothing herein shall be construed as, nor is Optimal Blue providing, any legal, trading, hedging, or financial advice.
About Optimal Blue
Optimal Blue powers profitability across the mortgage capital markets ecosystem. As the industry’s only end-to-end capital markets platform, our technology, data and integrations bridge the primary and secondary markets to help lenders of all sizes maximize performance – from pricing transparency and accuracy to margin protection and every step in between. Backed by over 20 years of proven expertise, our modern, cloud-native technology delivers the real-time automation, actionable data and seamless connectivity lenders need to navigate market volatility and scale for growth. To learn more about how Optimal Blue delivers measurable ROI, visit OptimalBlue.com.
News Source: Optimal Blue
Related link: https://www2.optimalblue.com/
This press release was issued on behalf of the news source, who is solely responsible for its accuracy, by Send2Press Newswire. To view the original story, visit: https://www.send2press.com/wire/optimal-blue-report-rate-rally-drives-28-surge-in-september-lock-volumes/


